Demographics of Hawai'i
This project was a product of a class I took in the Fall 2020 semester called ICS 484: Data Visualization. For the project, we were tasked with finding a set of data to focus on that we could use to create data visualizations that eventually led us to generate meaningful summaries based on the results of the data in our visualizations. For our dataset, we chose to focus on the demographics of Hawai’i as it was one of the more interesting datasets that we could find at the time, and there was plenty of data to look at to come up with meaningful analytical results. With this in mind, we then asked ourselves what were the questions that we wanted answered in order to be able to get something meaningful out of our project. From there, we were able to brainstorm and come up with the structure of our project and how we wanted to display each bit of information that we needed to so that anyone going through the site would have an easy time understanding what was going on at all times. As a result, after creating all the data visualizations based on the datasets that we looked at, we were able to successfully analyze the data and answer the questions that we initially came up with in order to get meaningful analytical results from the data and our graphs.
My role on the team was the project leader, meaning I was the one in-charge of the assignment of the project. I organized the meetings and tried to divide up the roles as evenly as possible, while also allowing my team members to choose what they preferred to work on. I tried to make sure everyone kept up and was on track to complete their parts of the project as needed. In the scope of the project, I was responsible for the median age page, located here as well as the Process page, located here. As I mentioned earlier, we tried to divide up the work evenly so that everyone had a chance to make a significant contribution, and I would say it worked out well in the end thus allowing us to put a solid product on the table.
As we know, at this time, our world was not in a great place due to COVID-19 and this was the first full semester of having classes fully online as a result. Throughout the course of this project, and this semester in general, I learned how to work together with others in a fully online environment. Typically, in the past, I was able to meet my groupmates a couple of times at least and I felt those meetings helped conversations flow well and they allowed us to produce meaningful work. Without those, it was definitely a little rocky at first as we were all still getting used to being in the online environment and working together with each other. However, we managed to figure it out and I definitely learned a lot from this experience. Another thing I learned about was the wonders of Miro. This was a brand new tool to me when I first started using it this semester and I can say that it is a very helpful planning and brainstorming tool. It allows for collaboration with others and gives users a space to just throw thoughts out while worrying about organization later. At the time of writing this, I have used it in other classes and projects as well and I can say without a doubt in my mind that this is one of the best brainstorming and just overall productivity tools that I have used.
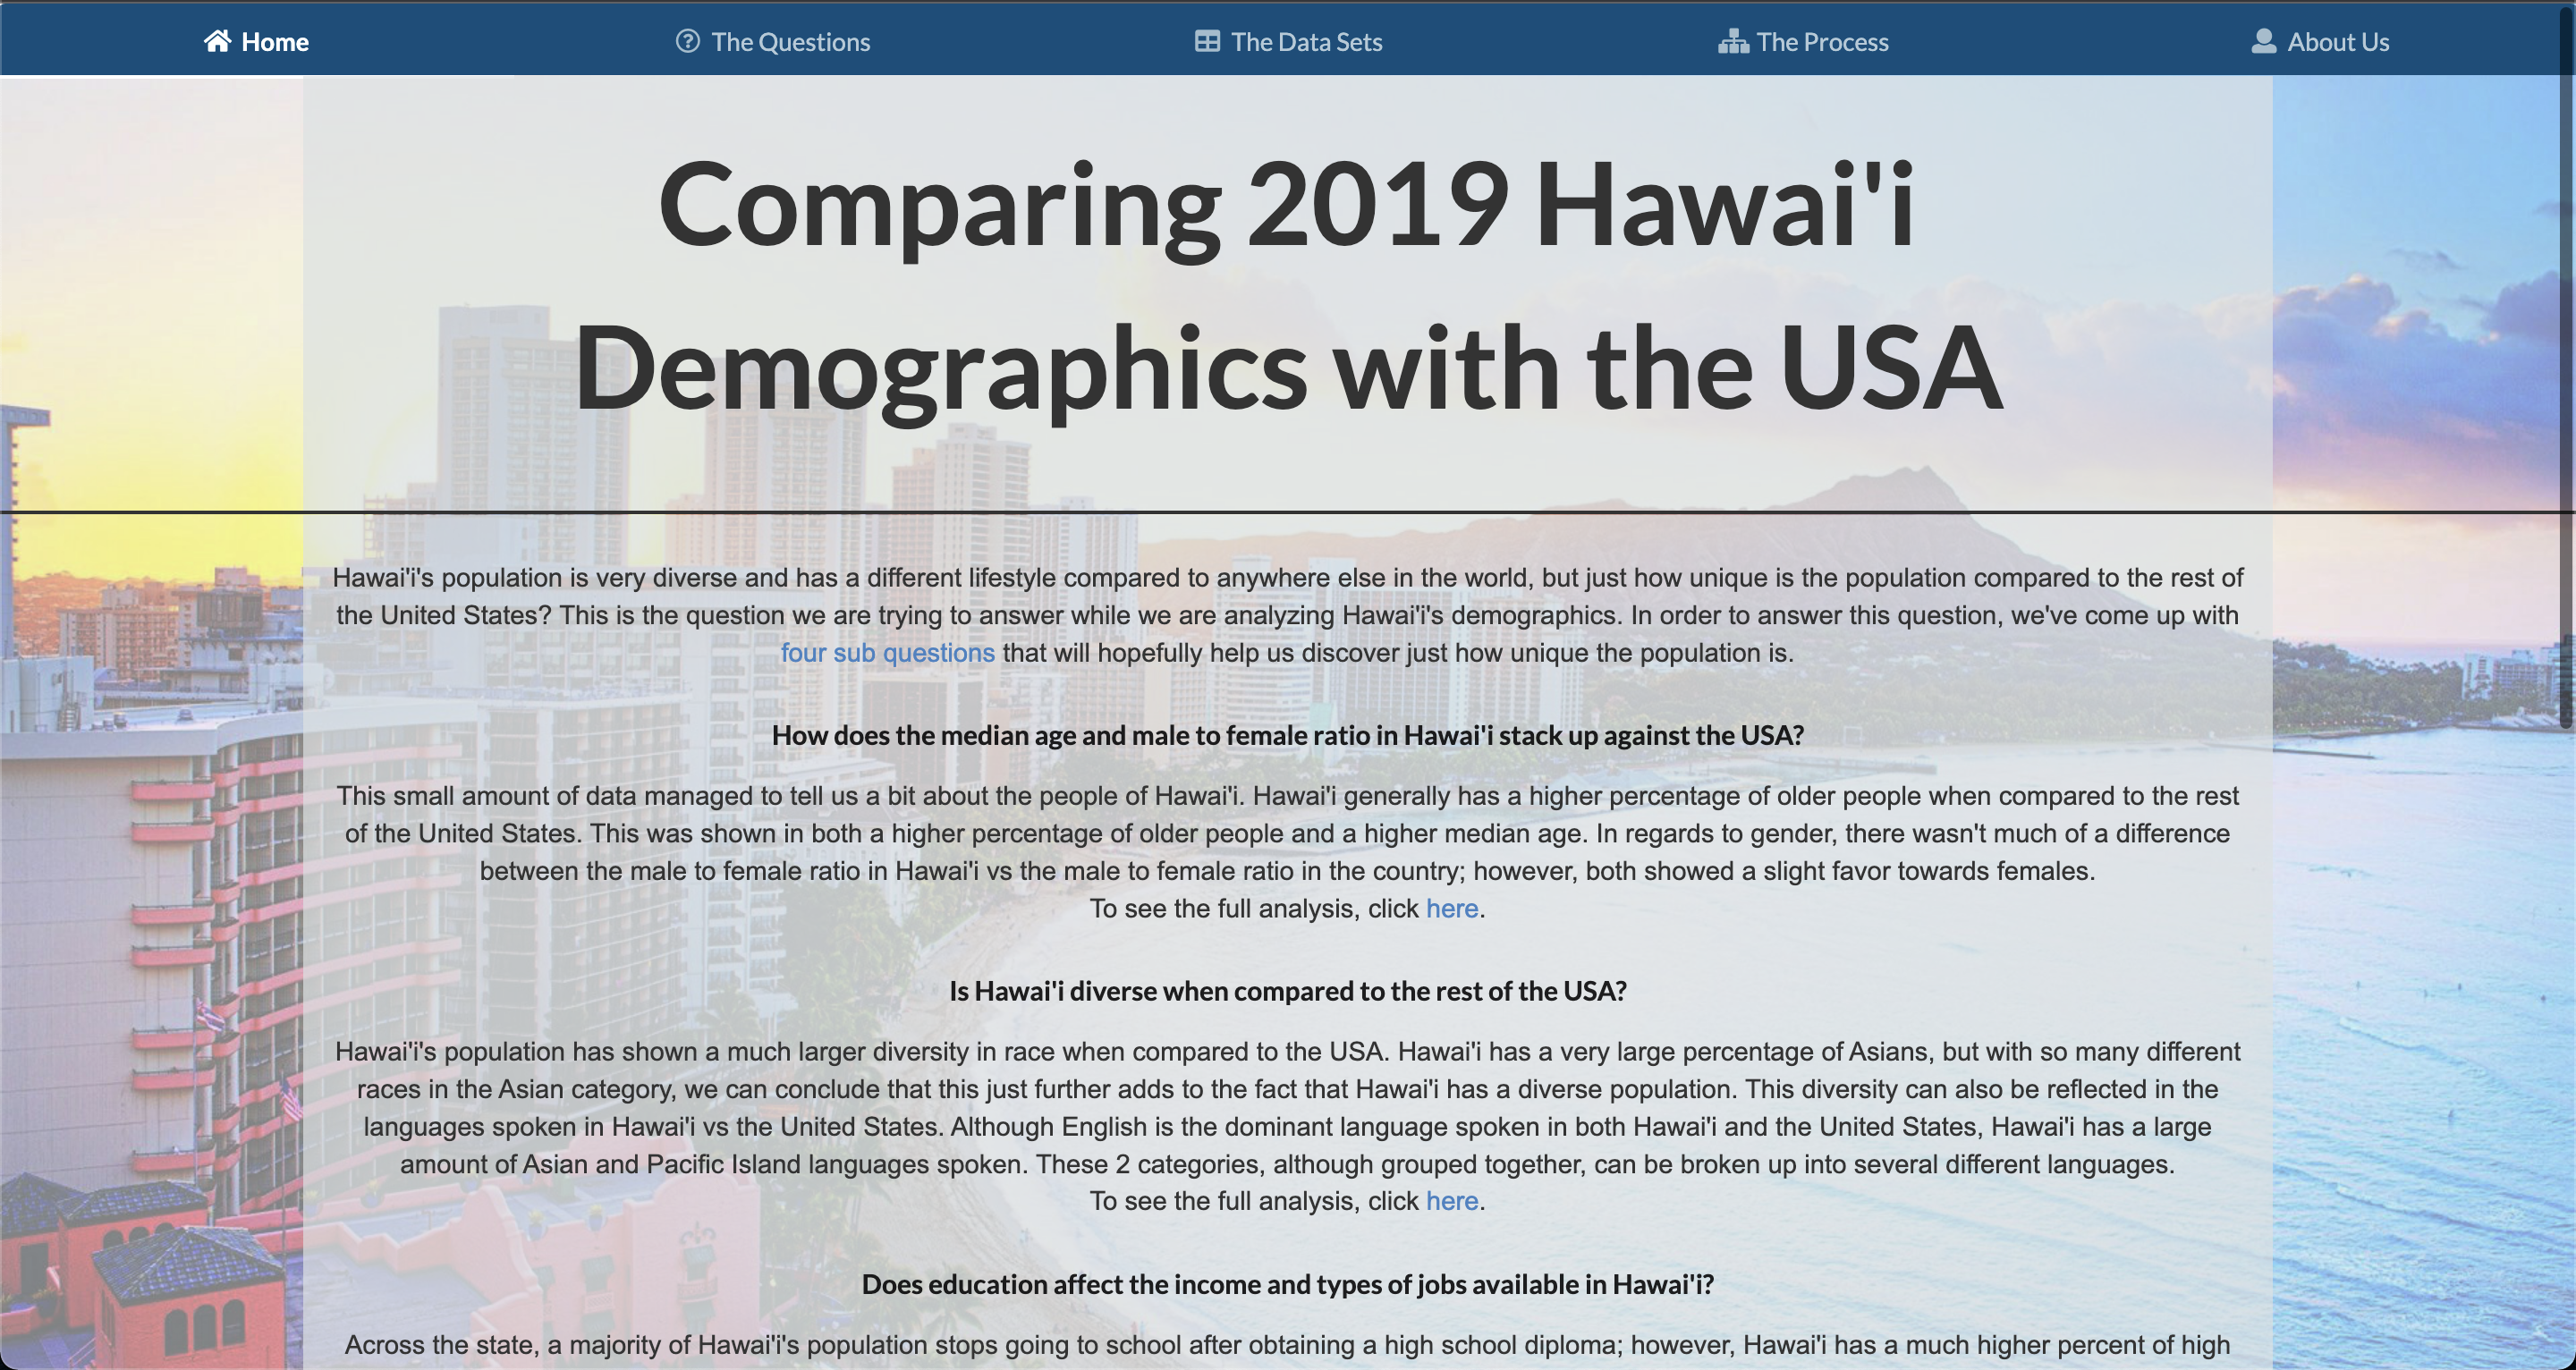
Here is a link to our project repo, and here is the link to our official project site. Below is a screenshot of the home page of our website.